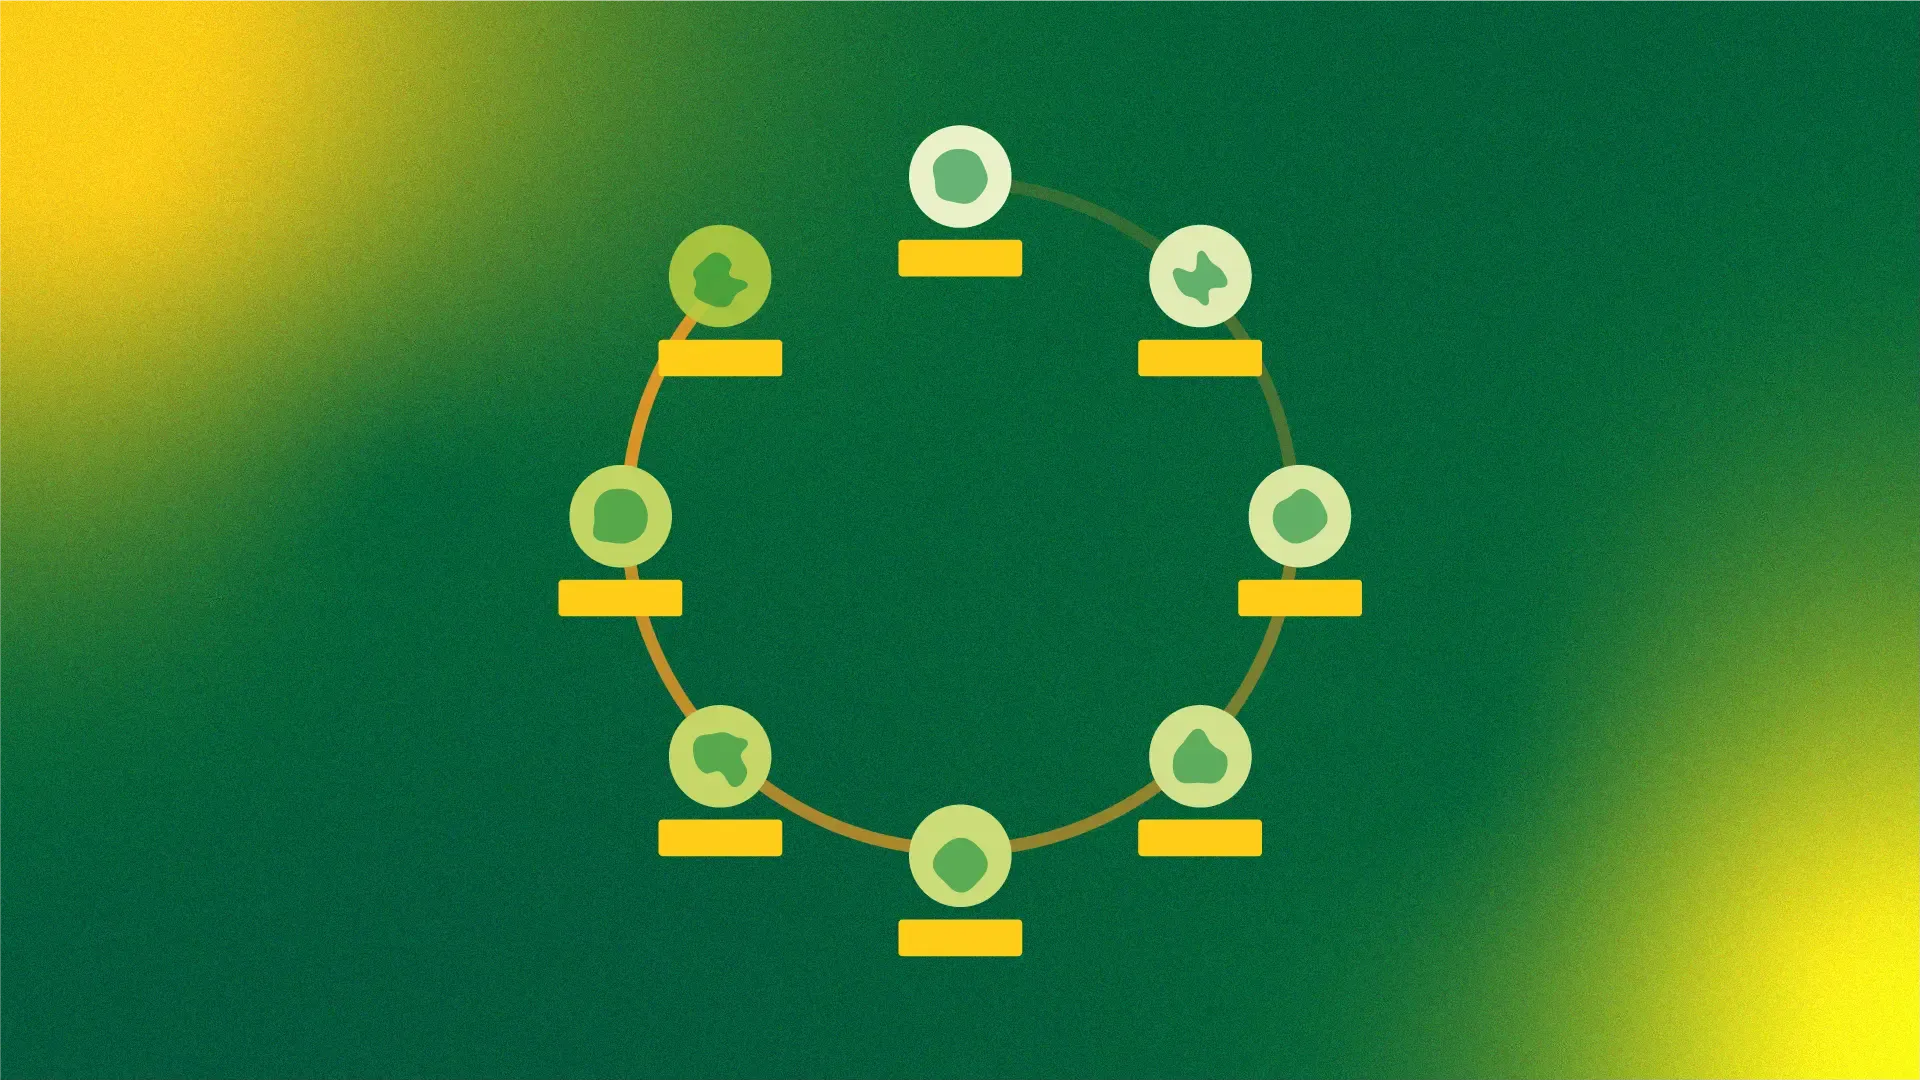
Fertiliser life cycle
Sustainability through fertiliser management
My role
Working with a group of Service Designers and agricultural subject matter experts to discover, define, and design with the fruit growing community.
Project overview
Understanding how fertiliser might be better managed on orchards to reduce agricultural emissions. This involved working closely with the growing community to conduct research and co-design potential solutions.
Approach
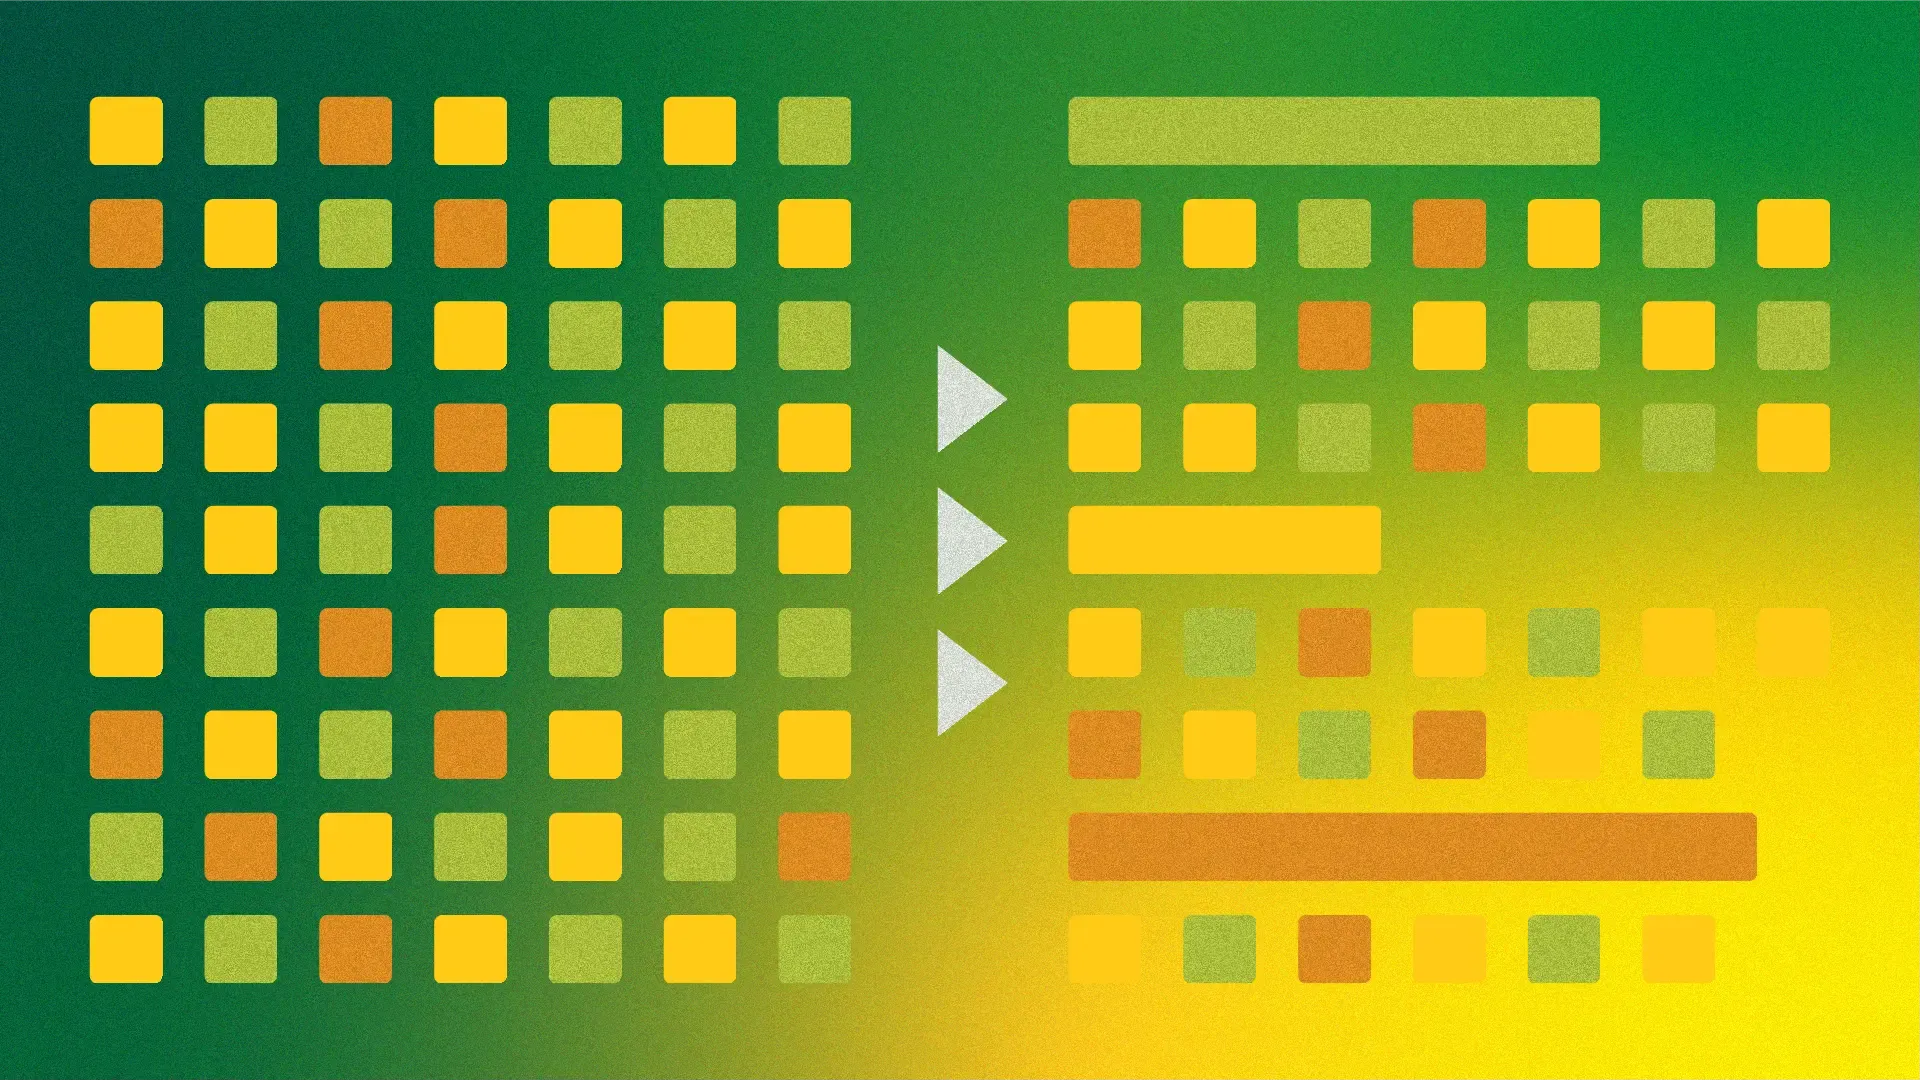
Research was conducted with the fruit growing community and companies that provided fertiliser related services. The project team split into pairs to conduct interviews and captured notes in a shared file. The team worked together to synthesize findings by grouping key concepts into themes. Insights were used to produce a journey map of the fertiliser life cycle to highlight current pain points. This was presented back to stakeholders to highlight the challenges faced by the growing community.
We worked as a project team to define where we should focus our effort to have the most impact on the current pain points. Through this process we decided to focus on standardising fertiliser recommendations and supporting data flow between companies and growers. We developed storyboards for potential solutions and workshopped the concepts with the growing community. Through this process, we were able to refine our designs for further user testing.
We developed a low fidelity data collection tool in the form of a spreadsheet to test with the growing community. This was done primarily to understand if the data would flow correctly between the various touch points. Through this process we refined our design until we had an MVP. The requirements were then captured as user stories ready for development.
Outcomes
The project identified how fertiliser management could be improved across the growing community and the findings resonated with stakeholders who had visibility of the work.
The MVP was left in a technically viable state, ready to be progressed as part of future development.
With changes to environmental regulations around agricultural emissions on the horizon, the project positioned the organisation to respond proactively rather than reactively when new requirements take effect.
Challenges
Scaling research - Due to the scale of the research it was difficult to ensure consistency of user interviews. This created variance in the length of the interviews and the level of detail in the notes. The process of synthesizing the interviews into themed insights was also more time consuming than anticipated.
Stakeholder alignment - Designing for the community was challenging as each group operated independently in the life cycle and had different motivations. The design needed to be effective in addressing the pain points but there also needed to be an incentive for each party to adopt the proposed solution.
Collaborative synthesis
The process of synthesising the findings as a team helped everyone get on the same page. Through this process we were able to share and discuss relevant moments from user interviews to further contextualise the insights.
Journey visualisation
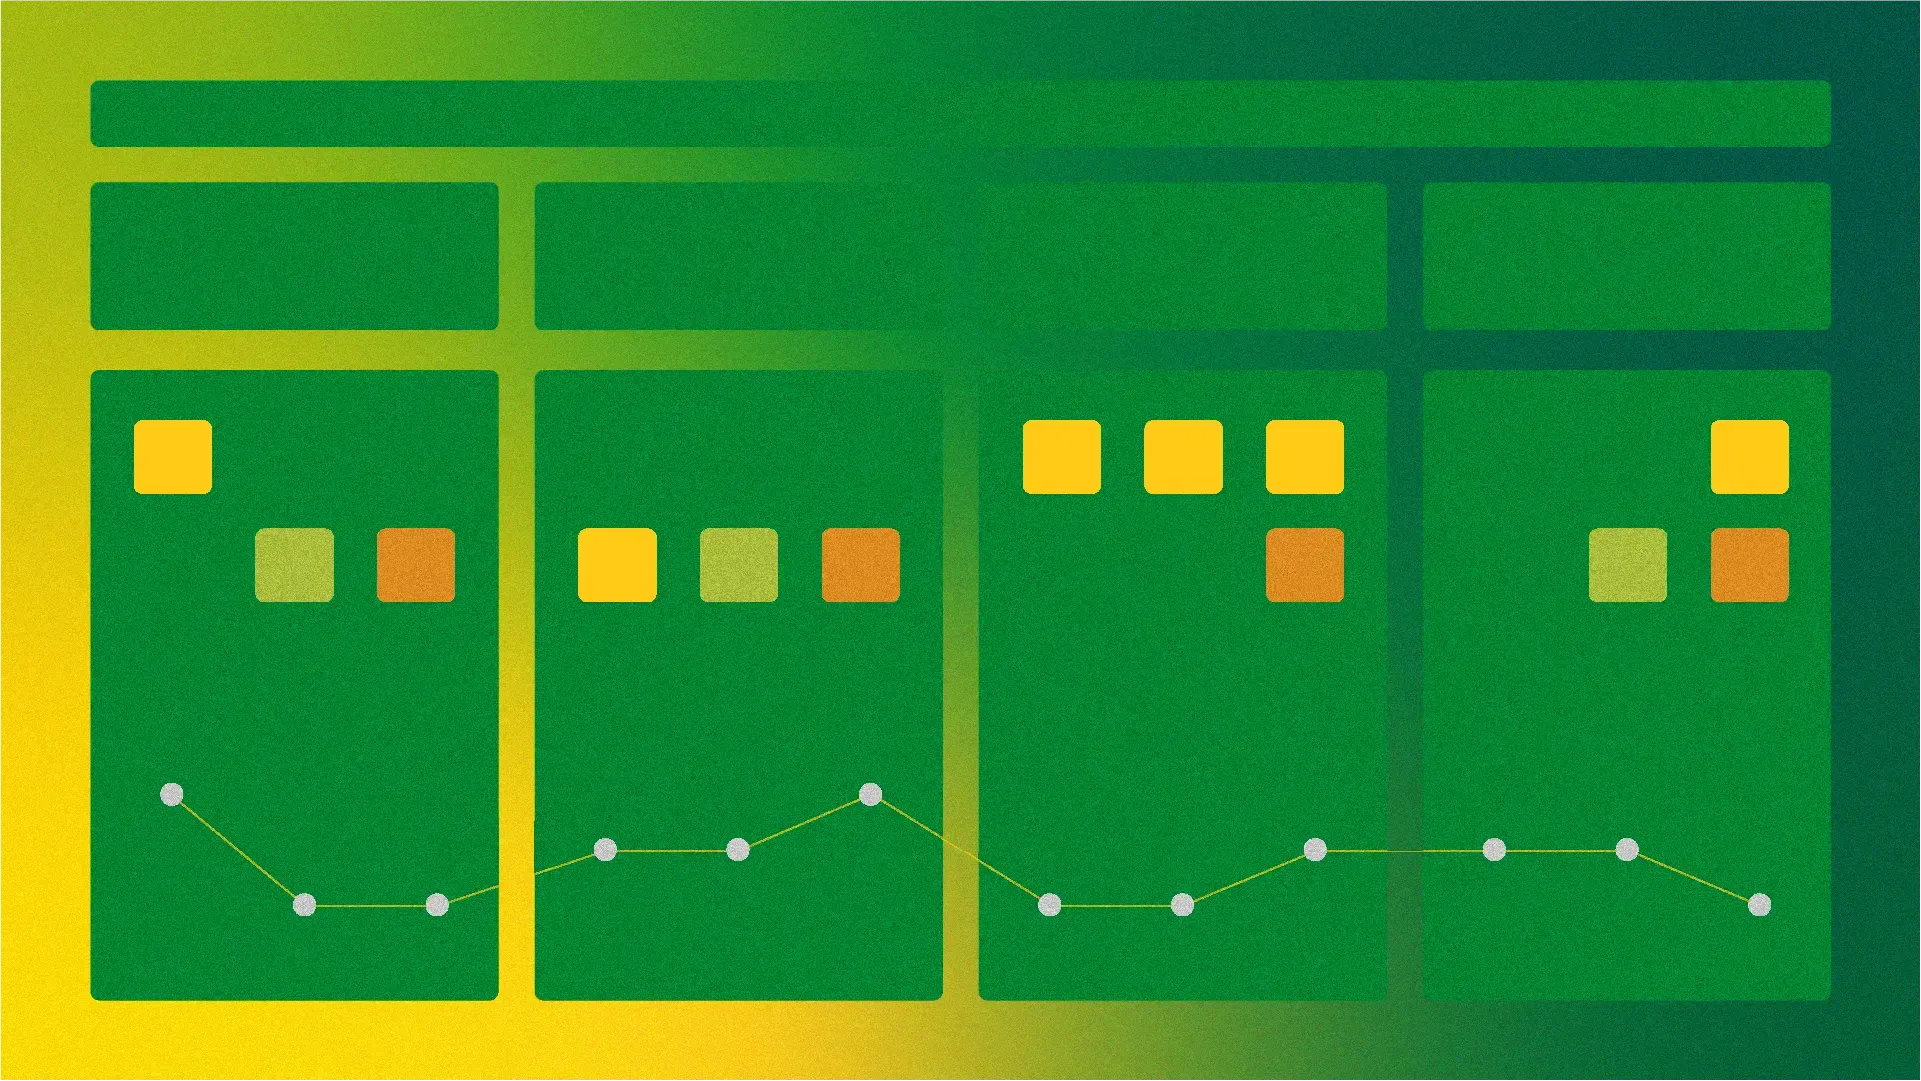
The journey mapping process helped summarise key findings. This also proved to be a simple and effective way of updating stakeholders and contextualising the next steps of the design process.
Lo-fi testing
We used a storyboard and a low fidelity prototype to test one of our concepts with the growing community. The storyboard was able to provide context and the prototype provided something tangible to centre the conversation around.
Lo-tech prototype
The choice to use a spreadsheet as a prototype for our MVP enabled us to work across the growing community because it was a tool that was already being used. Using a spreadsheet also enabled the team to rapidly iterate throughout the testing process.